Getting started with report writing using Quarto
Introduction

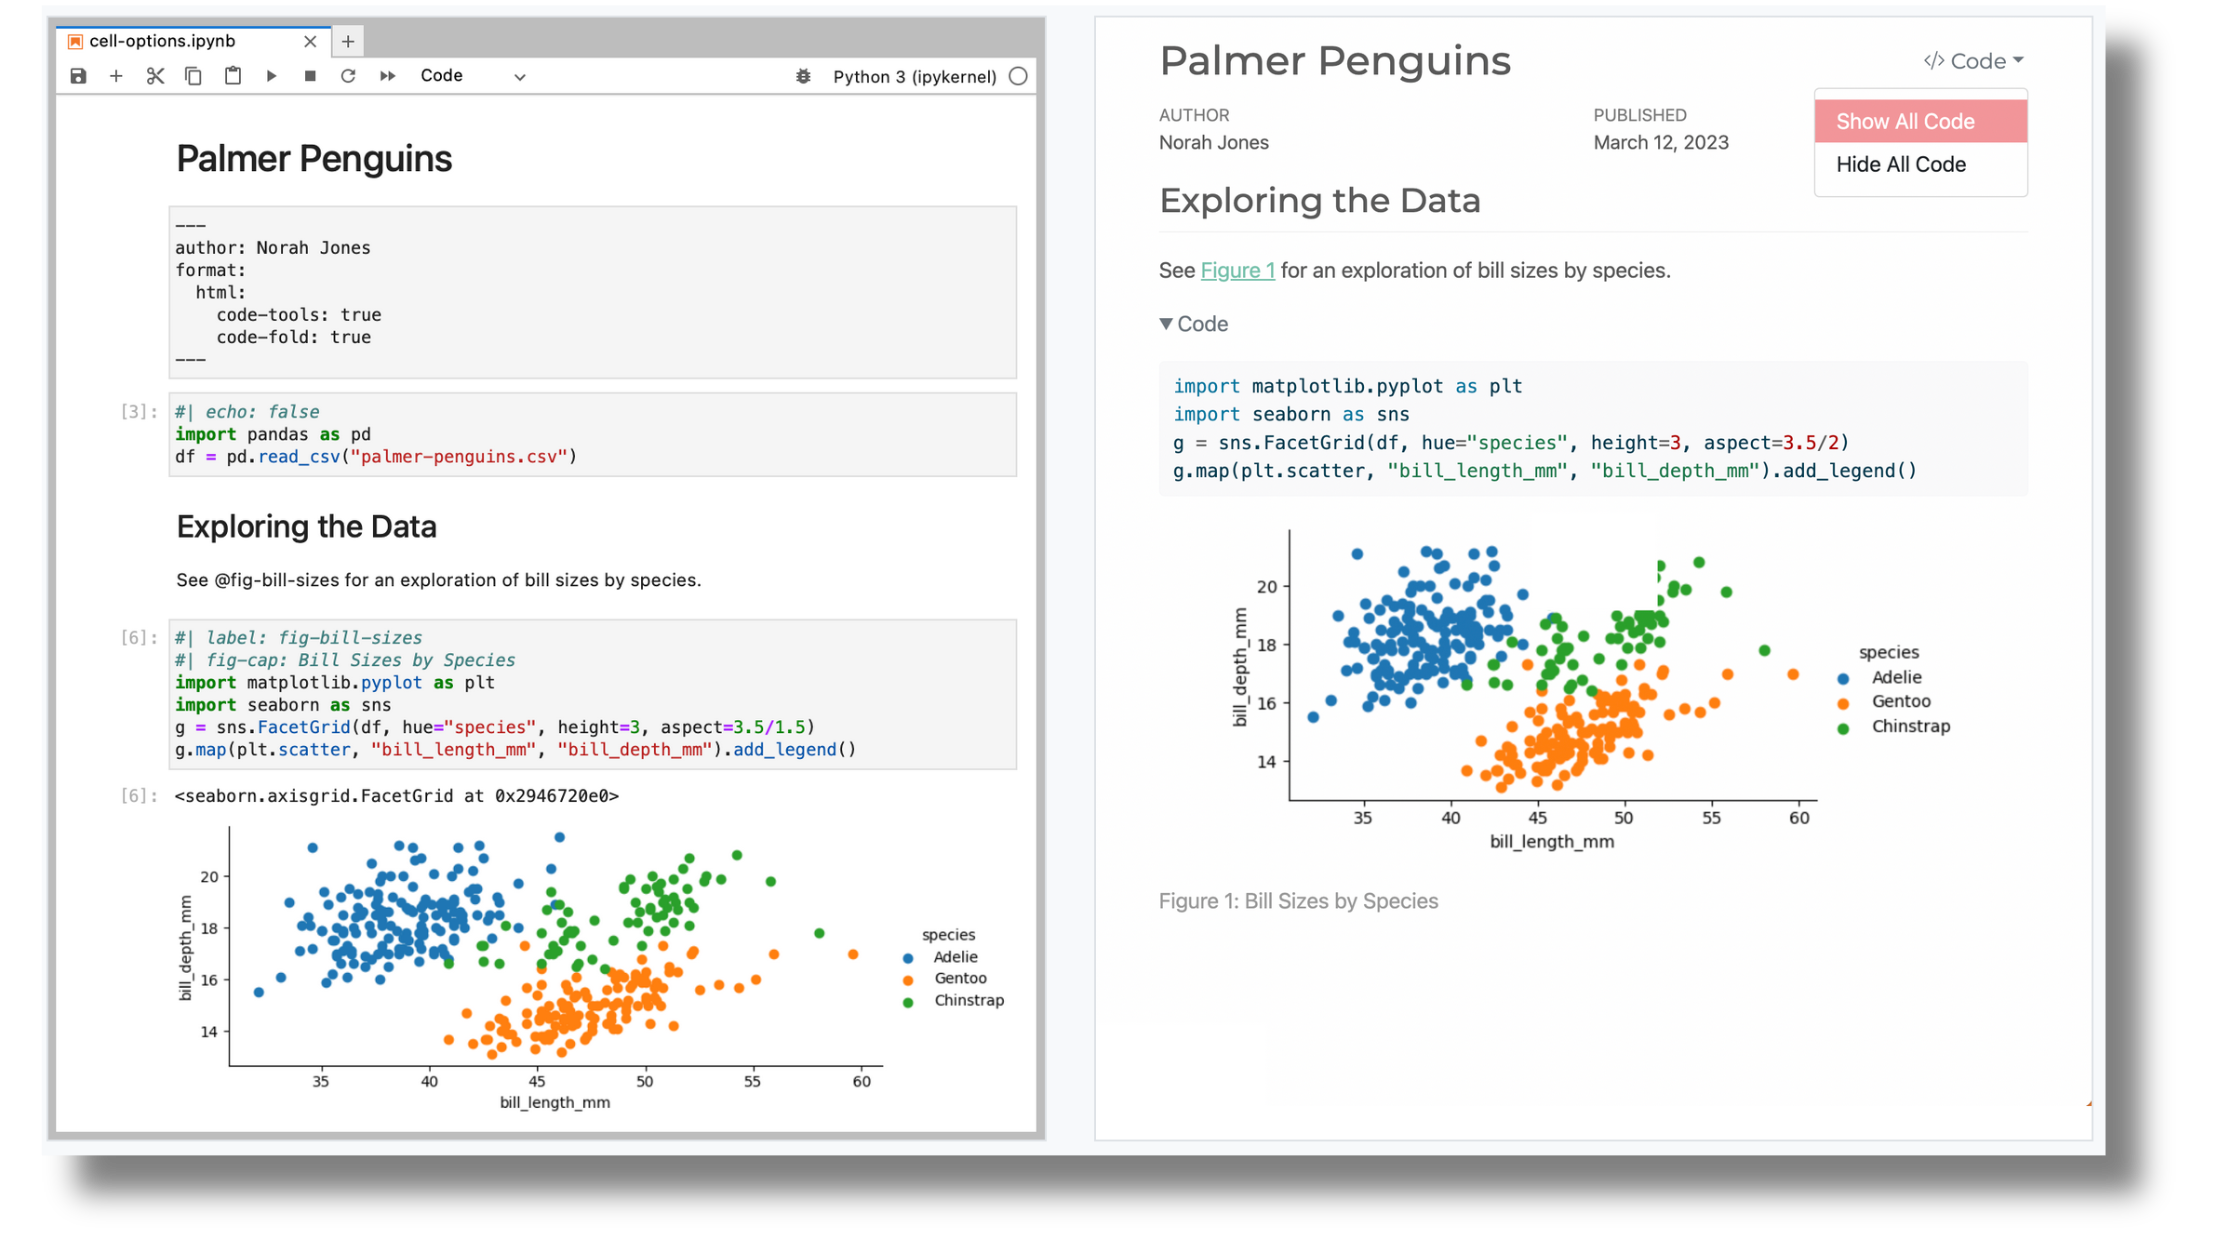
What we will create today

Data
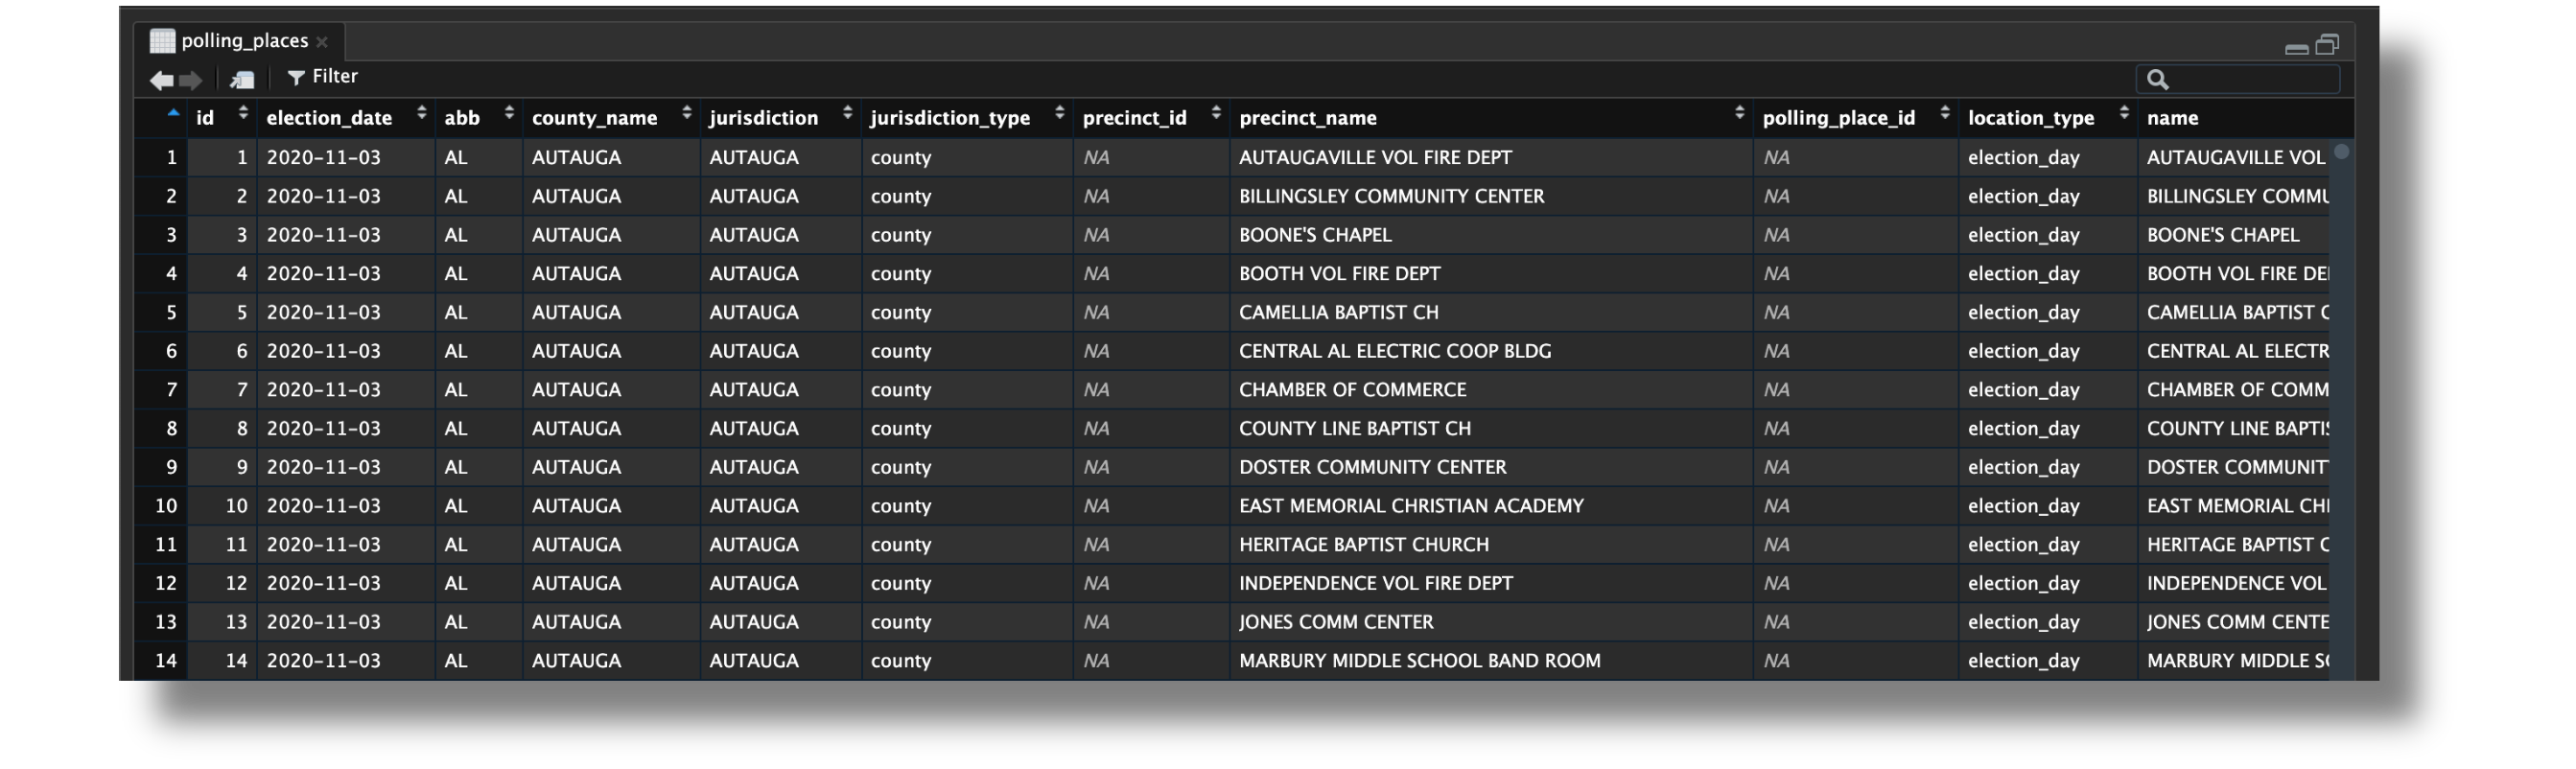
We will be using data from the latest TidyTuesday on polling places in the U.S.
- The dataset contains information on the election day(s) in the state, polling locations and their addresses, and various other data points
- We’ll be using a geocoded dataset thanks to @thedivtagguy’s geocoding analysis
What is Quarto?
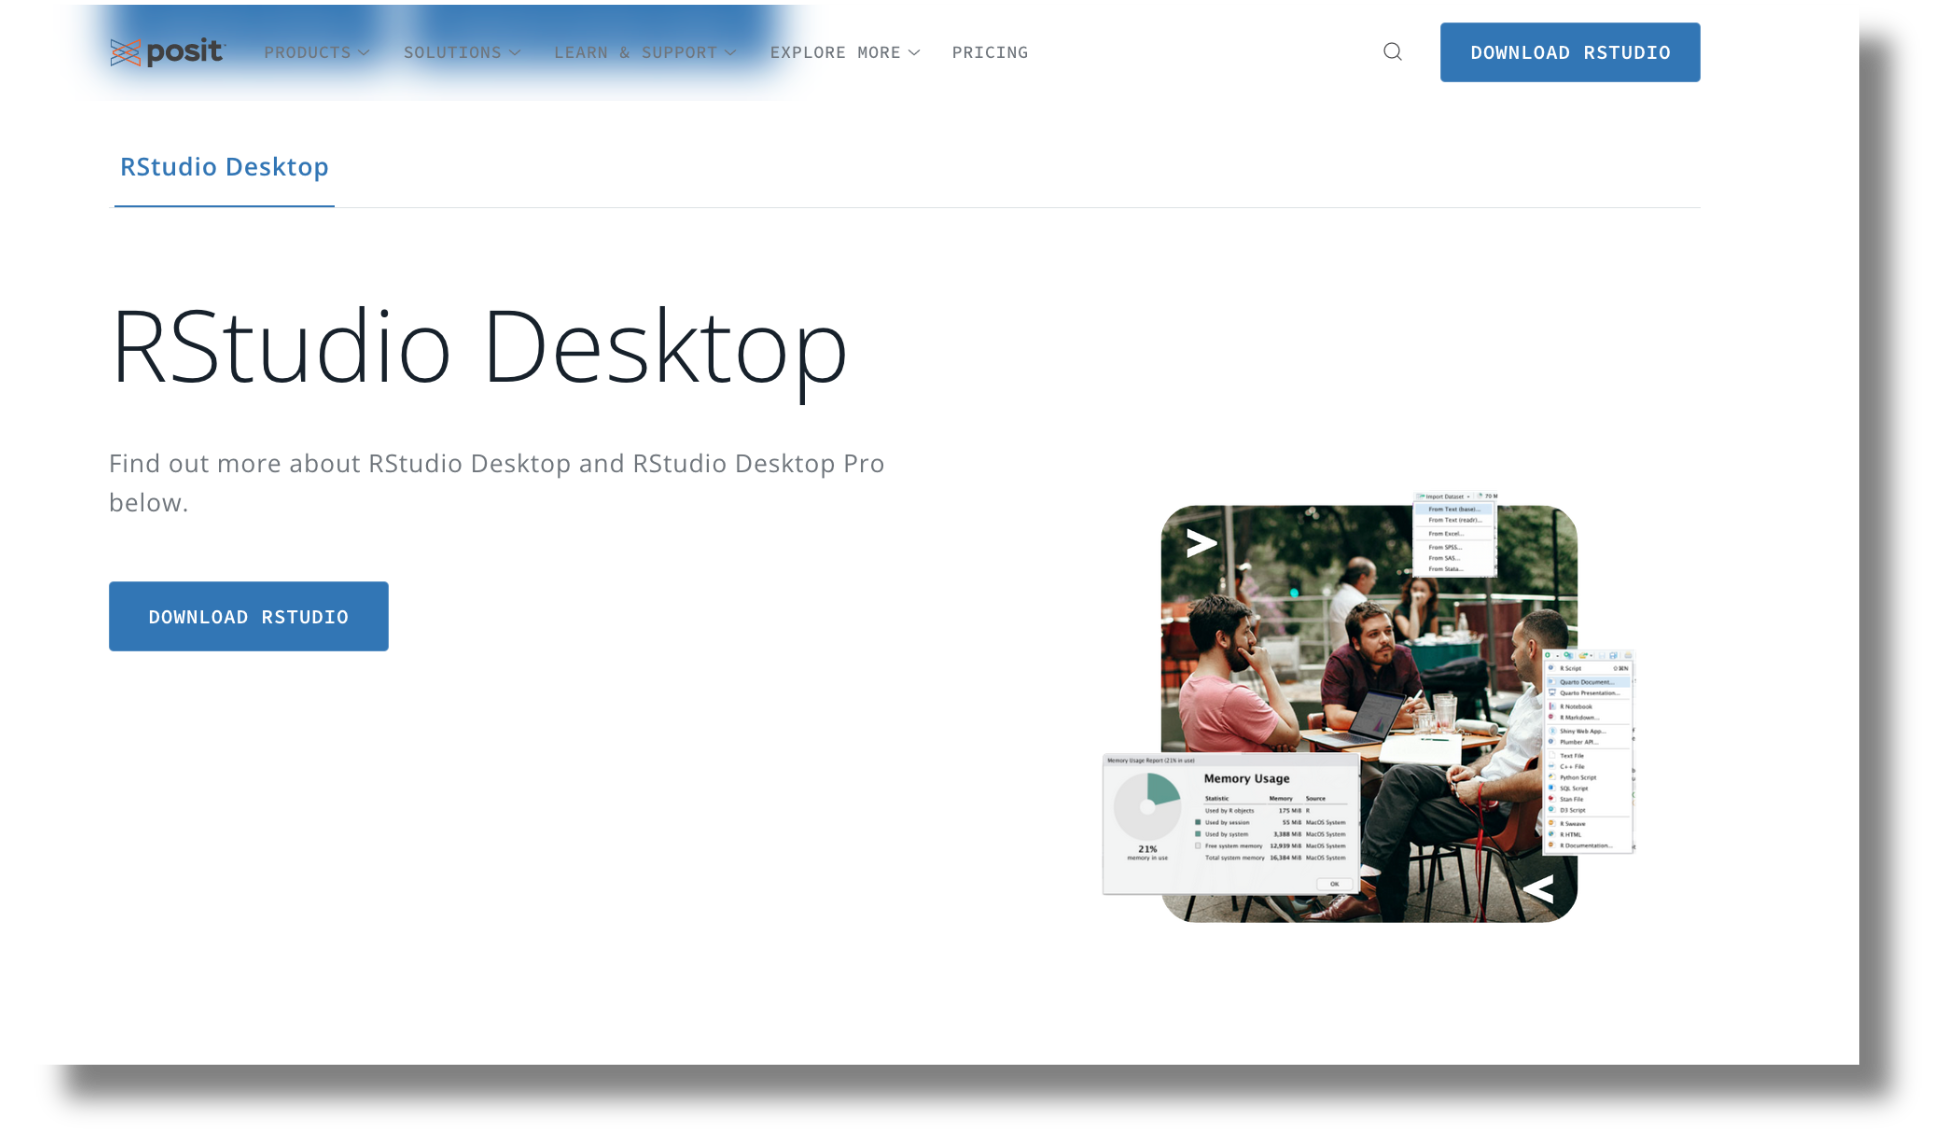
Installing RStudio
You can use Quarto in RStudio, VS Code, Jupyter, Neovim, and other text editors.
Today, we will use RStudio, which comes bundled with Quarto.
Creating a new Quarto document
Create a new Quarto document by going to File > New File > Quarto Document.
- Notice the
.qmdextension of the Quarto document

Creating a new Quarto document
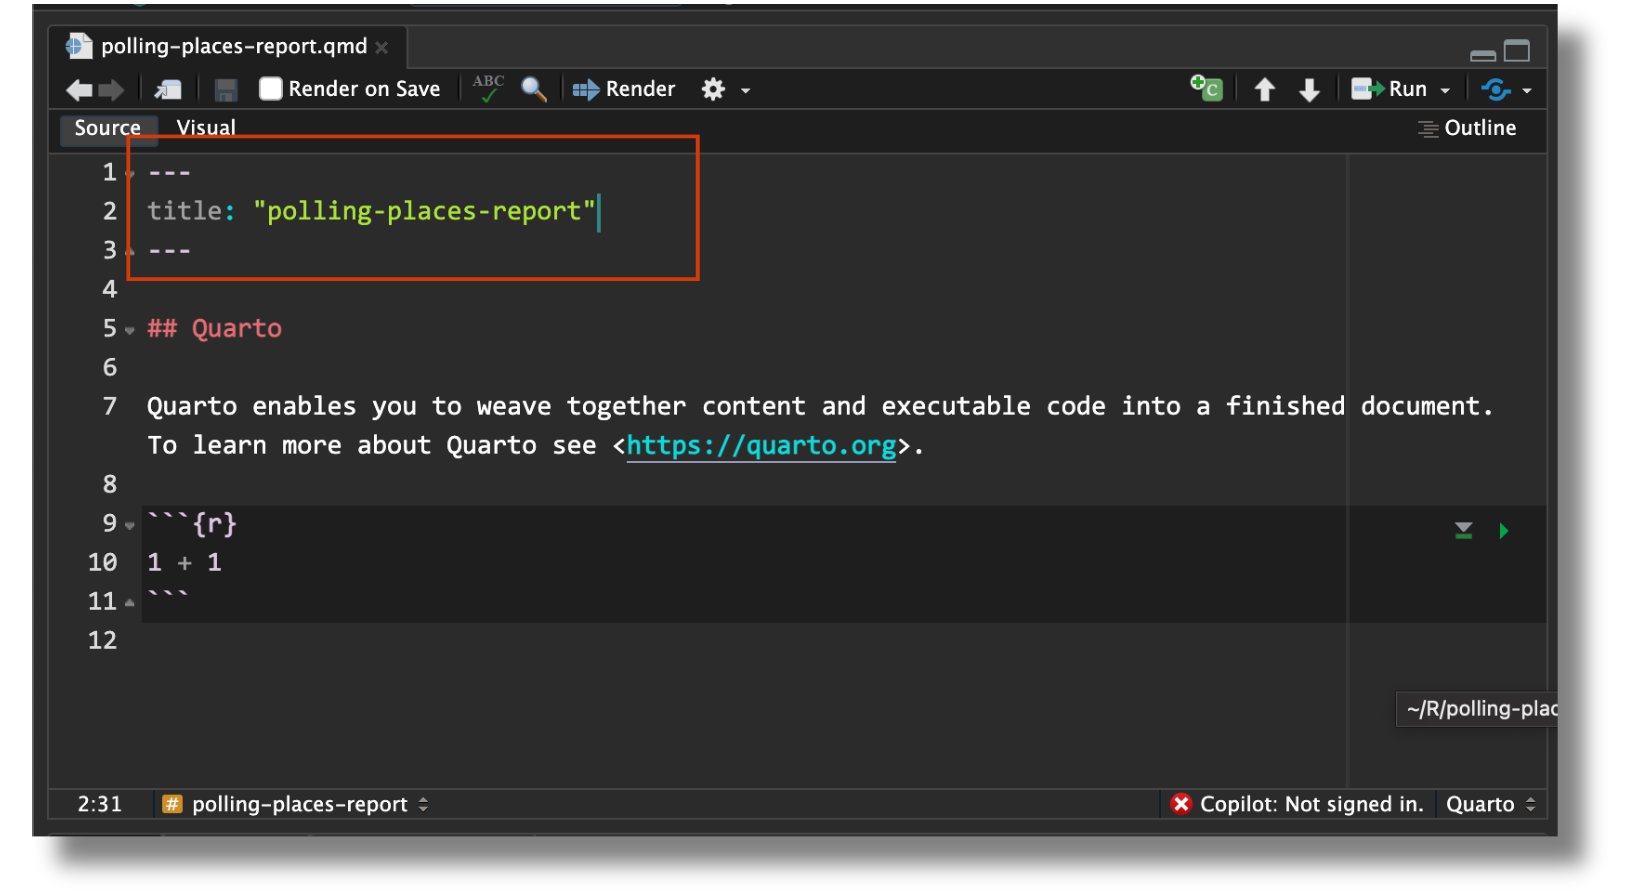
This is what the default Quarto document looks like:
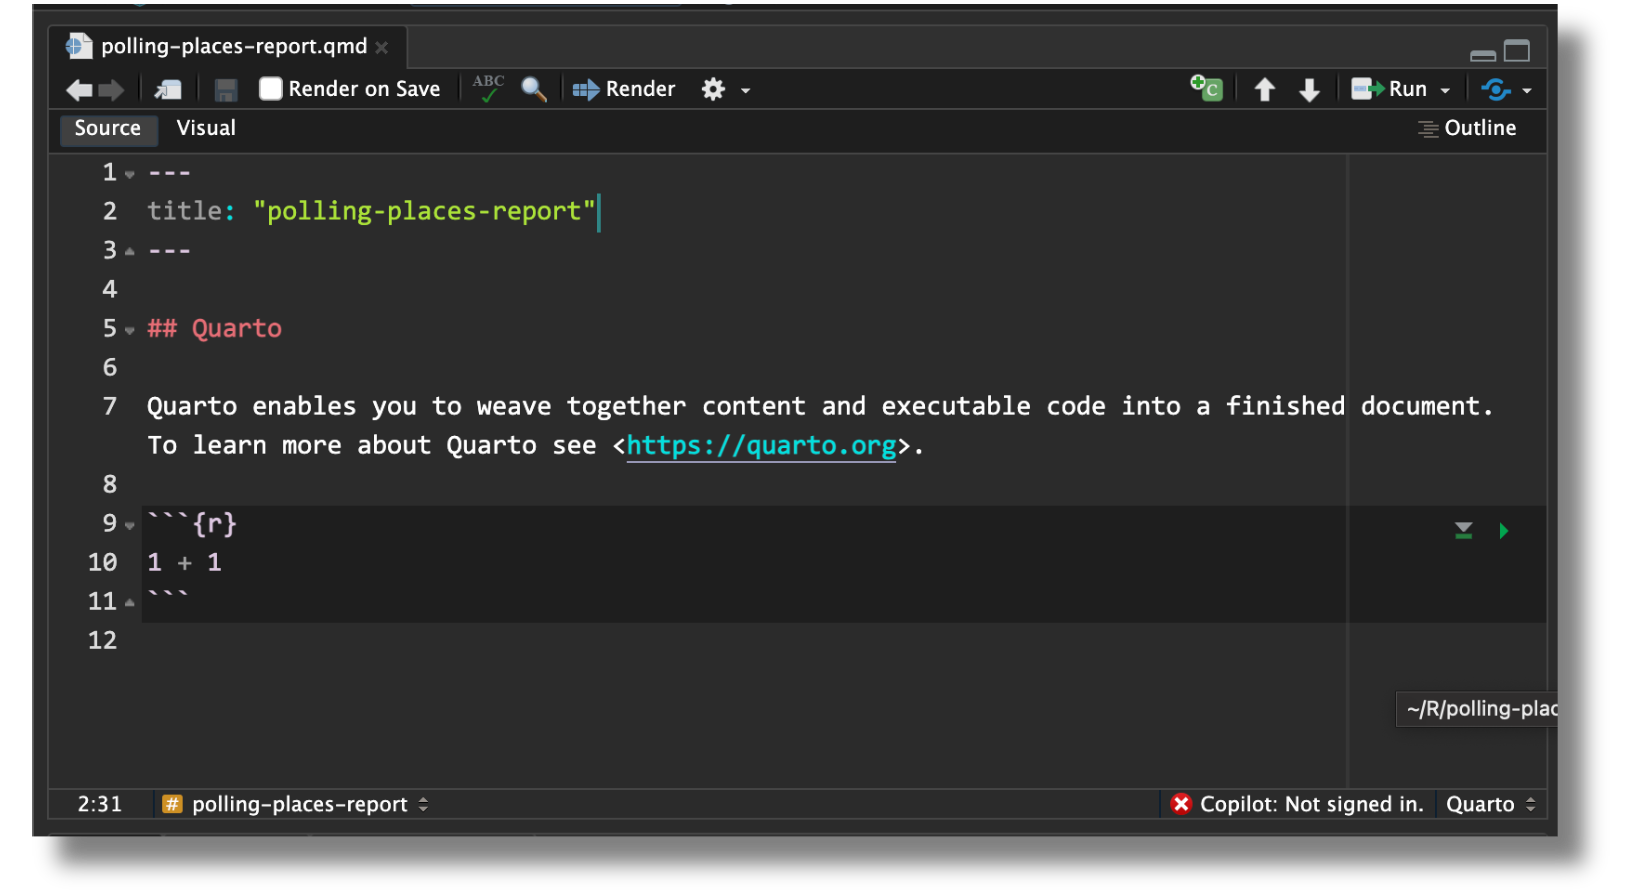
YAML header
- Metadata of your document
- Demarcated by three dashes (—) on either end
- Uses key-value pairs in the format
key: value
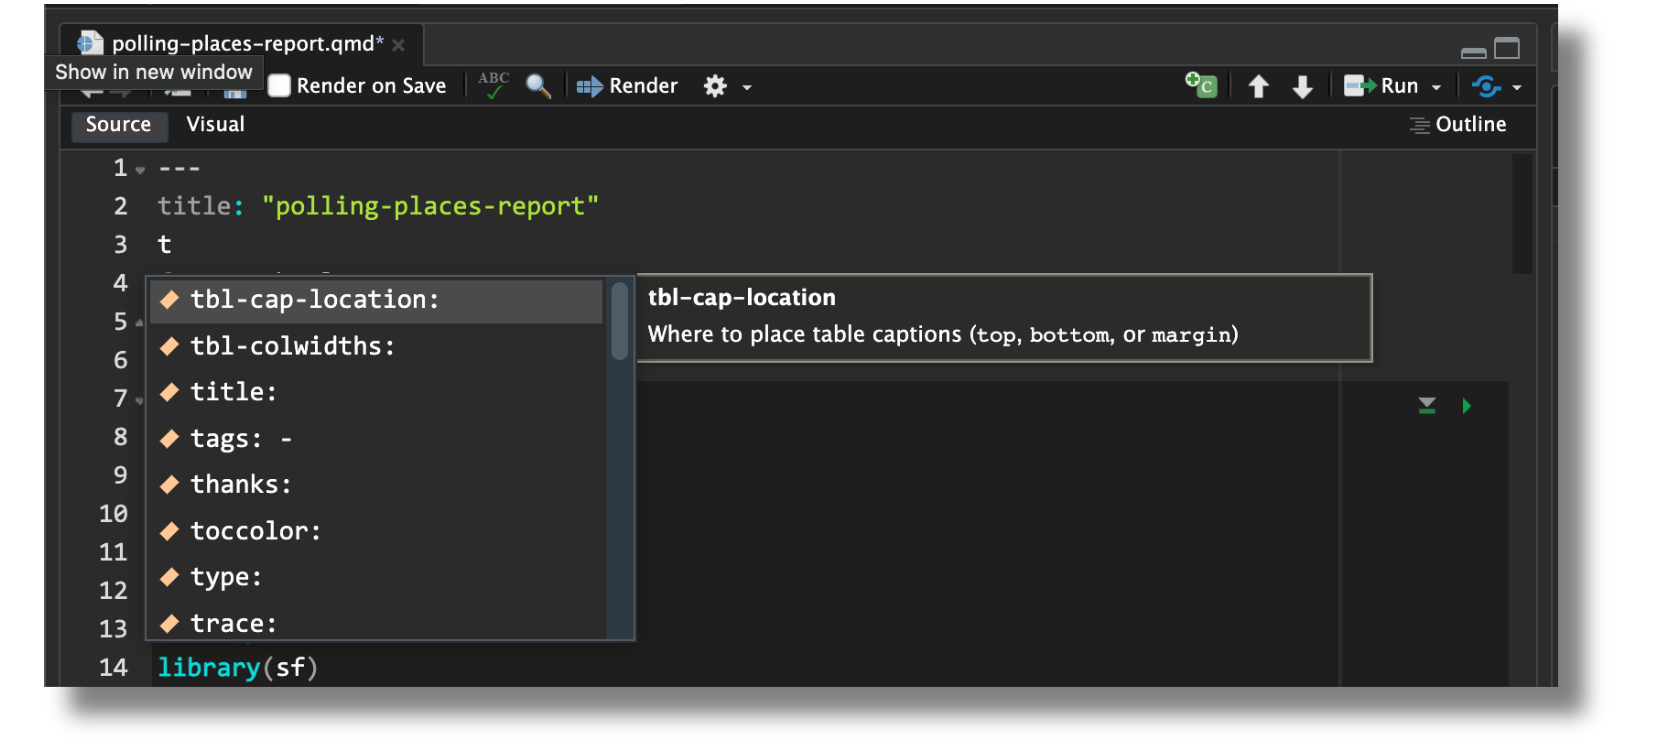
YAML intelligence
- YAML intelligence is available for project files, YAML front matter, and executable cell options
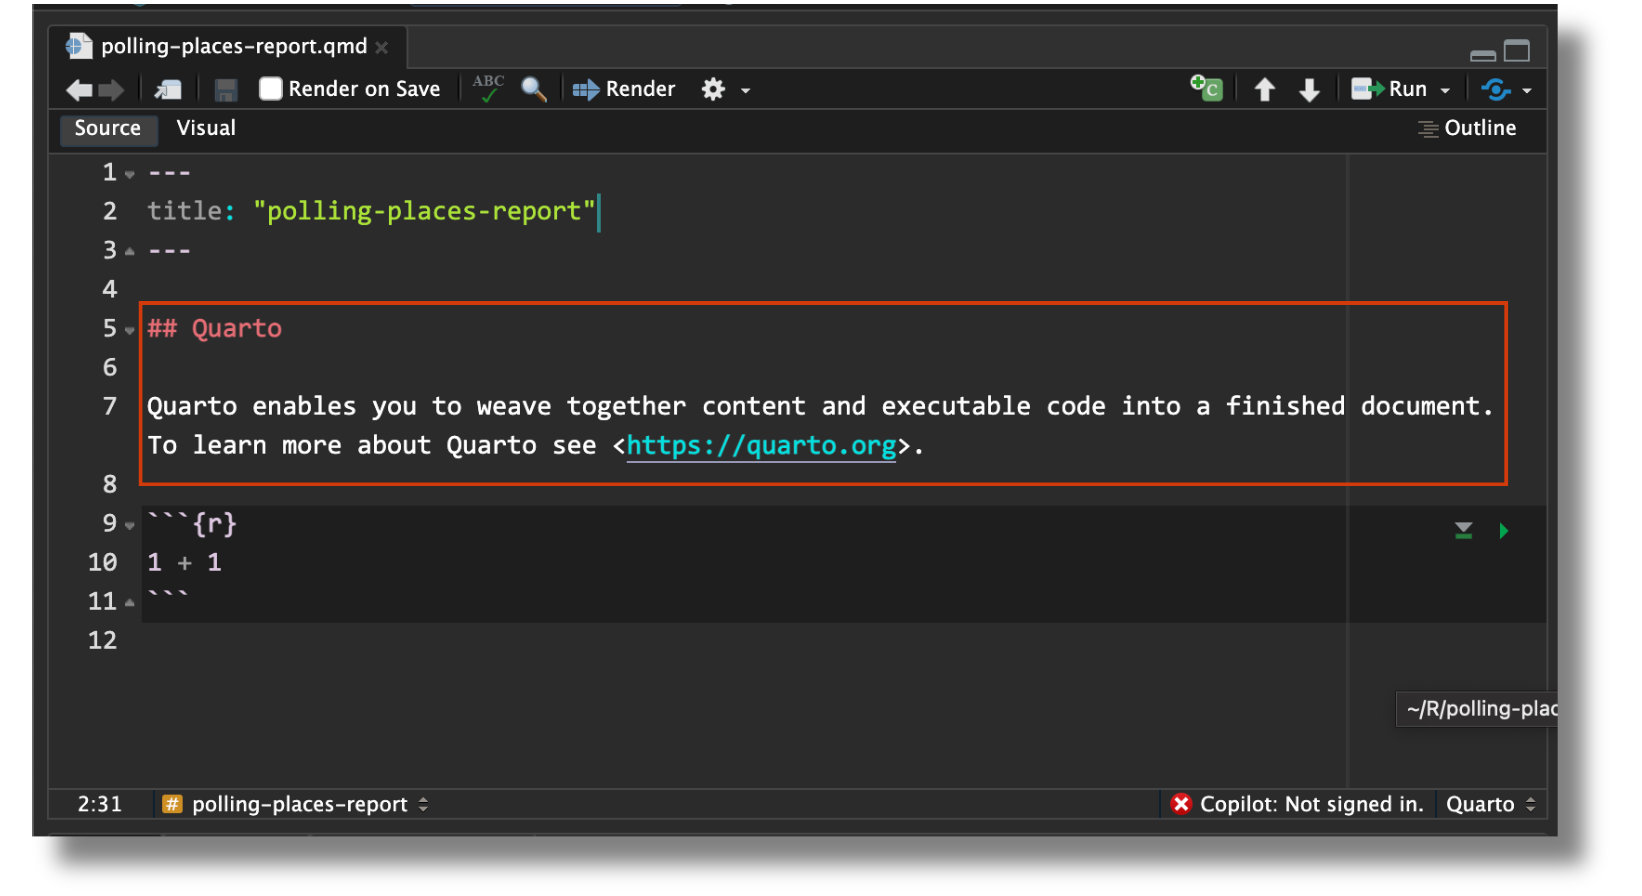
Markdown text
- Markdown is a lightweight language for creating formatted text
- Quarto is based on Pandoc and uses its variation of markdown as its underlying document syntax
Executable code
- Code chunks begin and end with three backticks (usually)
- Code chunks are identified with a programming language in between
{} - Can include optional chunk options, in YAML style, identified by
#|at the beginning of the line

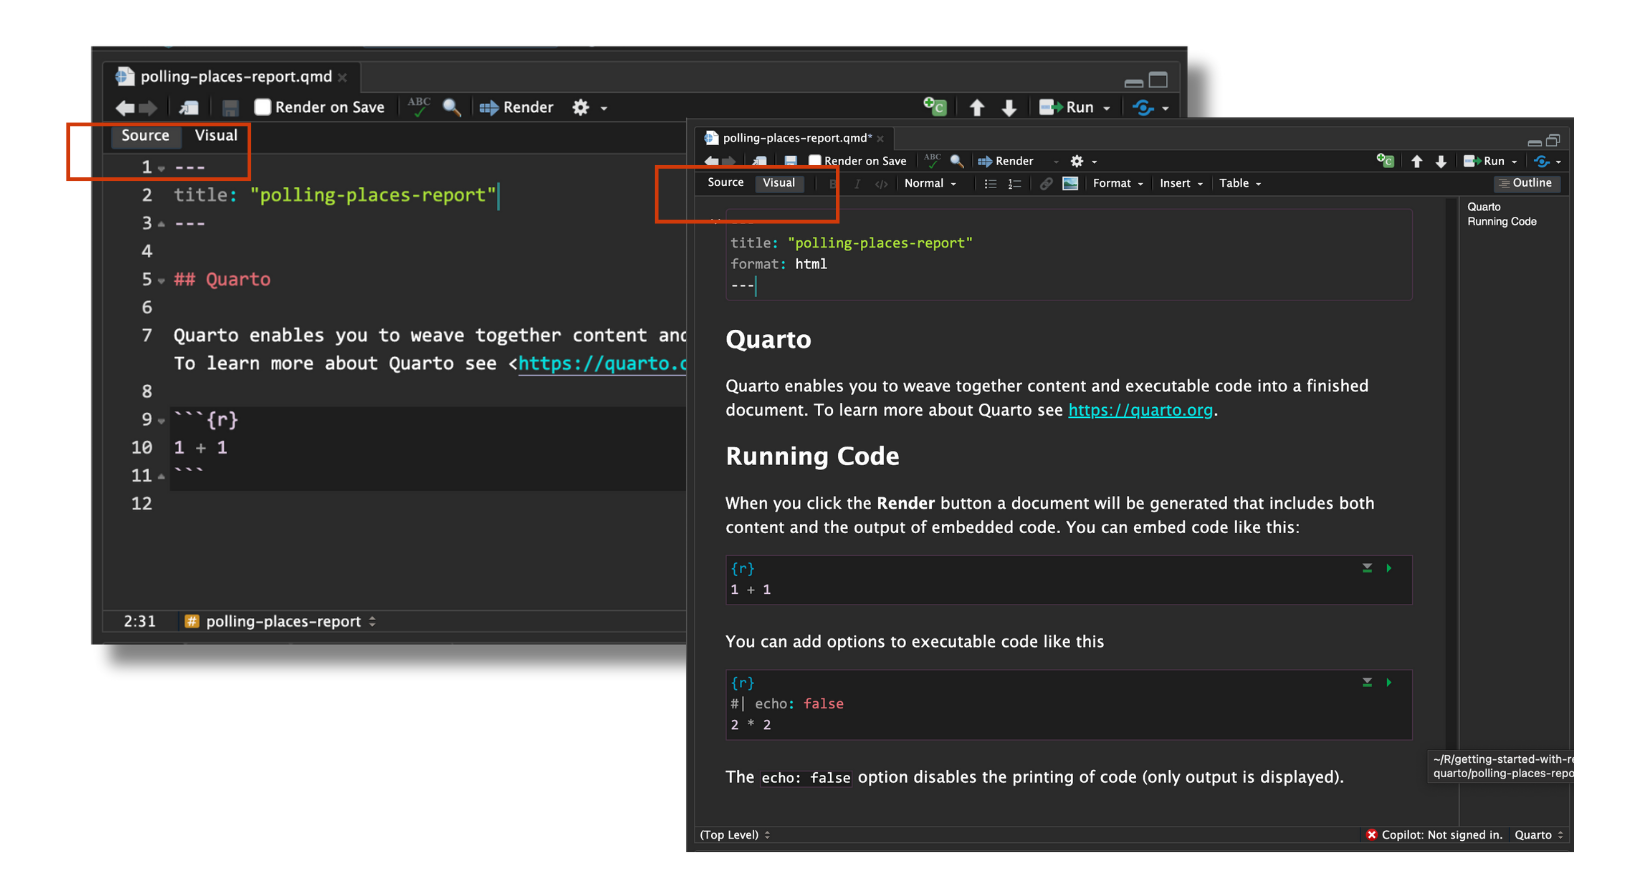
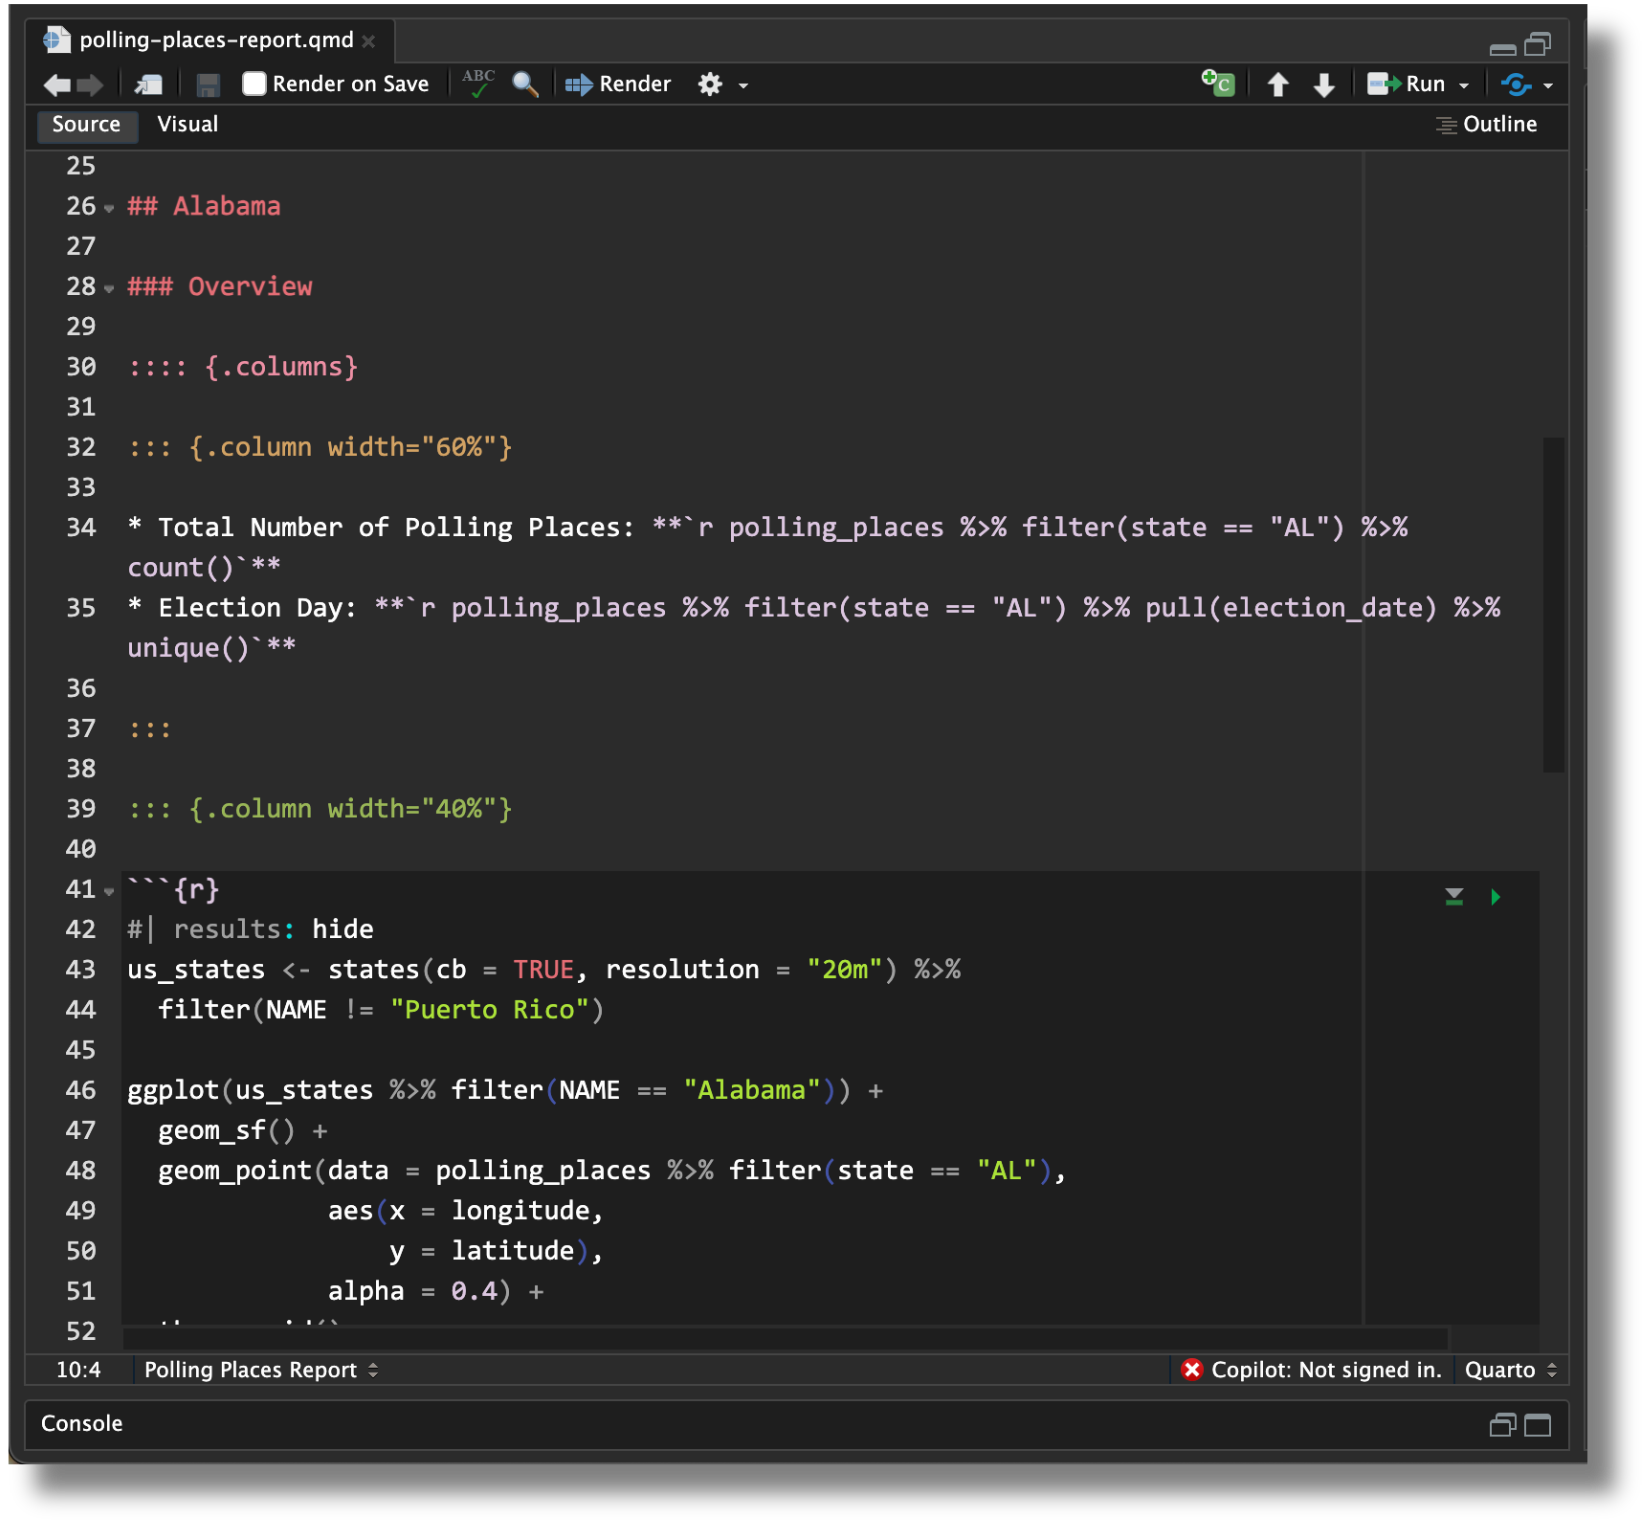
Two editors: source and visual
- RStudio includes a visual editor for Quarto markdown, including support for tables, citations, cross-references, footnotes, and more:
Creating a new Quarto document
Use the Render button to preview documents as you edit them.
- Check off Render on Save to automatically render whenever you save

Create a rough draft
Next, we can create a rough draft of the report by adding:
- Text and text formatting
- Headings
- Lists
- Figures
- Tables
- Columns
- Cross-references
- Captions
Notice how much we’d have to repeat for each report
- Manually creating tables for every county - 1881 counties!
- Manually creating report for every state in the dataset - 39 states!

Let’s automate the state reports using parameters
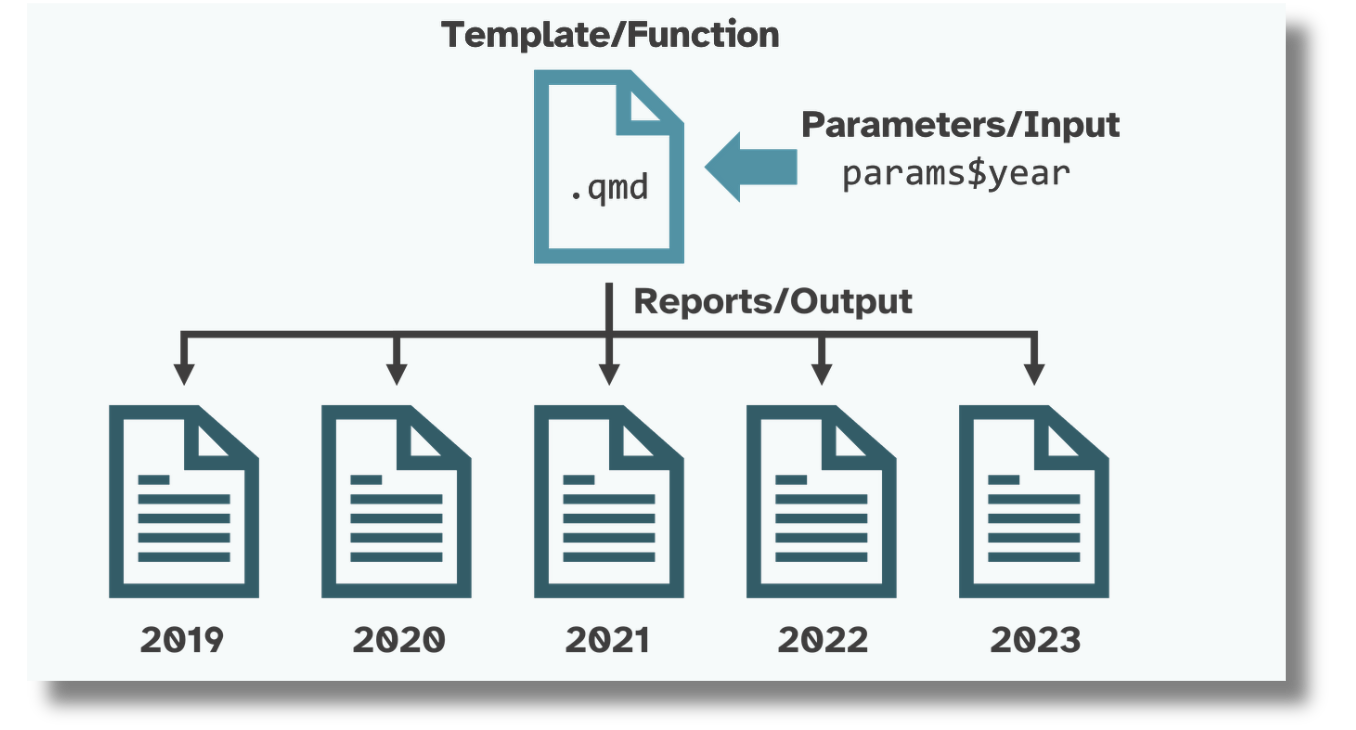
Source: Parameterized Reporting with Quarto by Jadey Ryan